
All the numbers are in, the official scores have been tallied and reported. Now it’s time to burrow beneath the surface and figure out who did what at the SC19 Student Cluster Competition. What I’m talking about is a deep analysis of the systems and respective team scores aimed at discovering which teams got the most out of their system during the competition. Who did the best job configuring their cluster, tuning it, and optimizing the benchmarks and applications? Read on to find out.
First, let’s talk methodology. I’ve been closely following Student Cluster Competitions for ten years now. During that time, I’ve always noticed that there are teams who seem to get better scores than their hardware would suggest they’d be able to get or what their competitors with more hardware achieved. The difference must be the job that students did configuring, tuning and optimizing their hardware and software – but how to measure it?
After several years of thinking, I’ve finally come up with a methodology that does the job, is repeatable and even understandable. It relies on two components: 1) The Machine Score and 2) The Application Scores which are used to generate the Efficiency Score.
Machine Score
This a non-weighted average of comparative system components. Why non-weighted? Because different components have different impacts on particular applications – and to custom weight each component for each application would require us to profile each app, and we don’t have the equipment or skills to do that. It seems that the fairest thing to do is to keep the weights equal, all things considered.
We look at six different factors, including number of nodes, CPU cores, CPU frequency, total memory, accelerator cores and interconnect speed. Stats for each component are added up, averaged, and then normalized for each team’s configuration. This is their machine score.
Application Scores
We do much the same process with the application scores. We add up the totals for all teams, take an average, and then compare that to each team’s individual scores. That gives us a percentage figure for how well each team did vs. the average for all teams.
The Efficiency Score
Comparing the Machine Score with the Application Score yields the Efficiency Score and often shows us a much different picture of what happened in the competition. For example , a team might only have six GPUs and just a few nodes, which might give them a machine score of only 68%. This might translate to them having the 14th ranked system in the competition.
However, they might have done a hell of a job optimizing a particular application, earning an Application Score of 110%. The official scoring would probably show them somewhere in the mid to lower part of the pack based on their results. But our Efficiency Score for that team would be 120%/68% equaling 162% -which is a damned high Efficiency Score and certainly deserving recognition.
The whole point behind exploring the scores to this depth is to recognize the teams that have done the best job tuning/optimizing their systems and software.
With that long-winded explanation out of the way
, let’s get to the SC19 Efficiency Scores:
SC19 Efficiency Scores
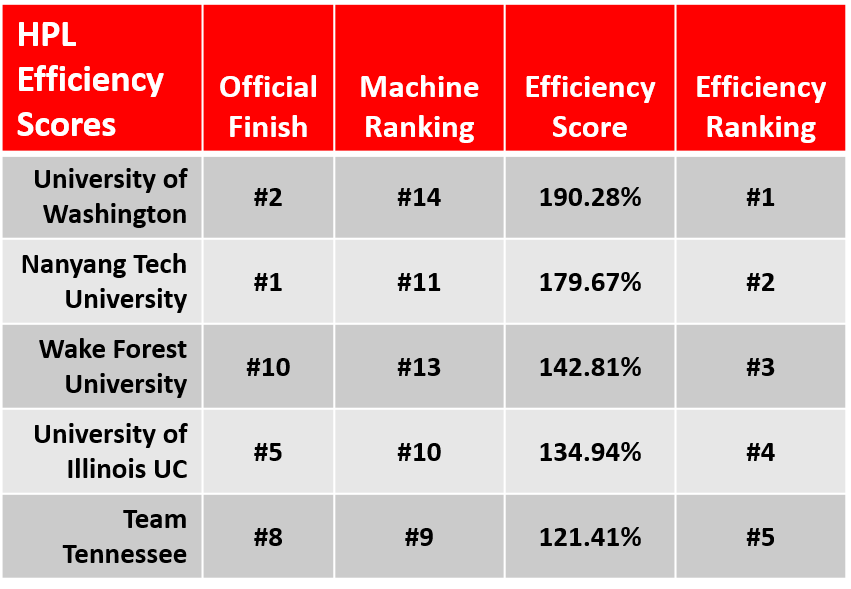 First up is the venerable HPL (LINPACK) application. It’s been in every single Student Cluster Competition and is well understood code.
The University of Washington Husky team pulled in the highest efficiency score on LINPACK at 190.28%. This measure, just as a reminder, is a comparison of their machine score (which was ranked 14th) and their comparative score on LINPACK (they had the second highest score at SC19). Their Machine Score was 69%, meaning that it was 31% below average when measured by its components (processor speed, cores, accelerator cores, etc.)
Nanyang Technological University, the official winner of LINPACK, was second on the efficiency scoreboard with a score of 179.67%. Wake Forest, who officially finished tenth on LINPACK, were the third most efficient team even though they only had the 13th most powerful system, which is an extraordinary result. University of Illinois Urbana-Champaign, and Team Tennessee rounded out the top five in terms of LINPACK efficiency.
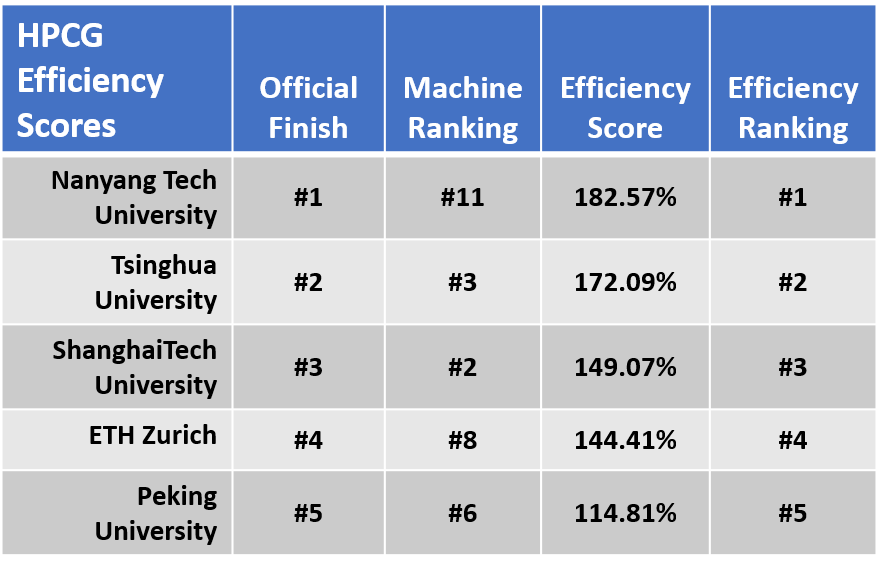 The HPCG results are a mirror finish of the official results with Nanyang turning in the highest official score and also owning the highest HPCG efficiency ranking. Likewise, Tsinghua, ShanghaiTech, ETH Zurich and Peking University earned the same efficiency ranking as their official results.
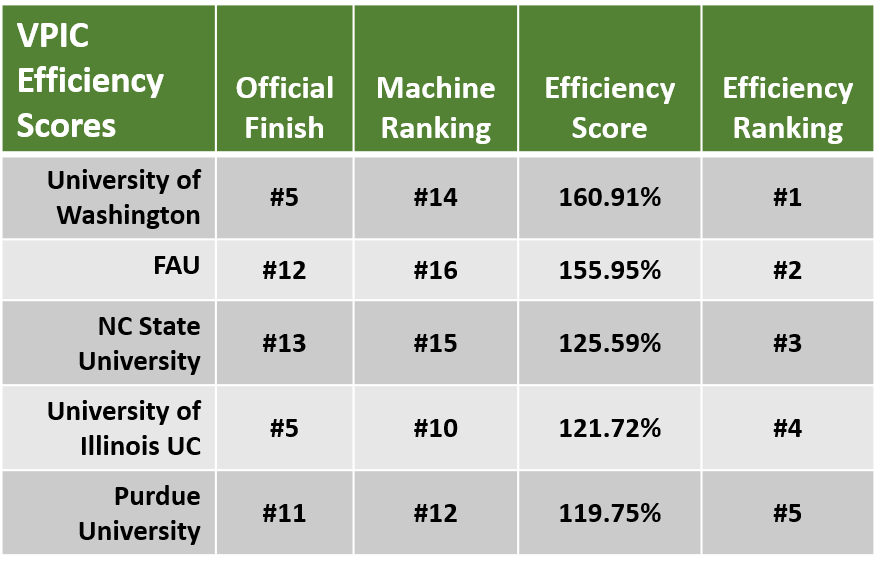 Things get interesting with VPIC. As you’ll note from the chart, none of the teams with the highest efficiency made it into the top four on the official scoring roster. The teams that were in the top four in official scoring all had higher machine scores than those who had the highest efficiency scores.
That’s what I like so much about this type of analysis, it digs deep and pulls out the teams who deserve to be recognized for their tuning/optimization prowess and who wouldn’t be noticed otherwise.
University of Washington was the king of VPIC efficiency with their chart topping 160.91%. FAU, with their NEC Aurora vector machine, found a great groove and posted a 155.95% efficiency score. NC State University grabbed third with 125.59% while University of Illinois and Purdue were nearly deadlocked at 121.72% and 119.75% respectively.
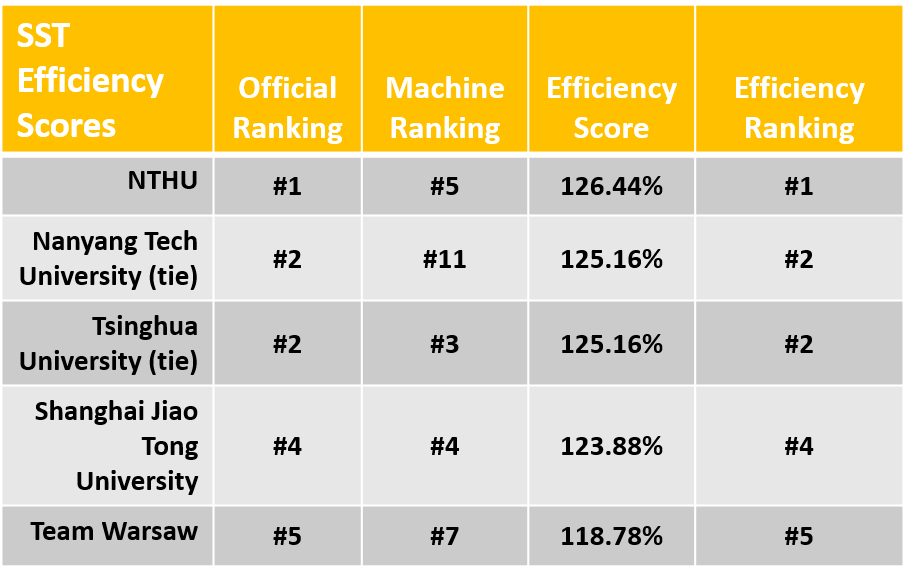 Results from the SST app were exactly in line with the official results, with NTHU first, Nanyang and Tsinghua tied for second, Shanghai Jiao Tong fourth, and Team Warsaw in fifth. All of the team efficiency scores on this app were in a narrow range from 119% to 126% as well.
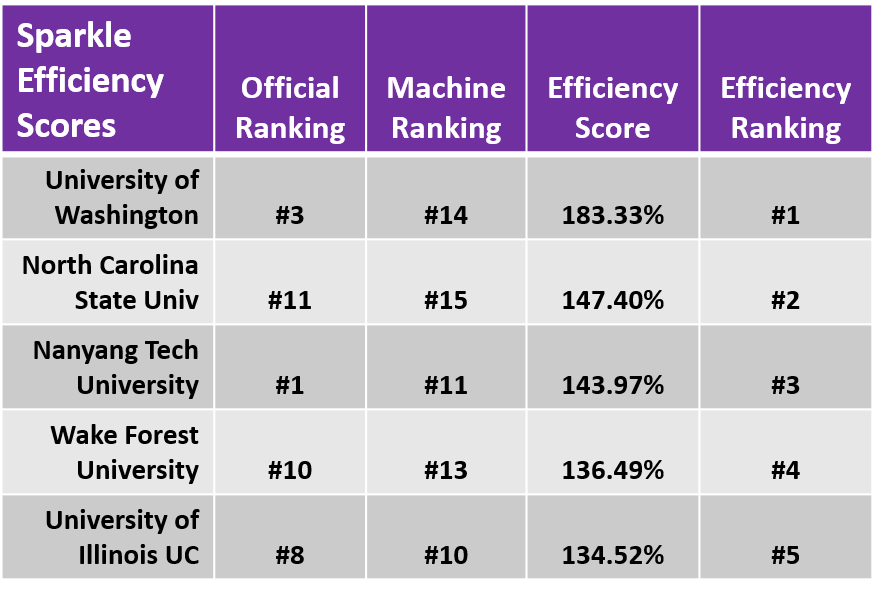 Efficiency scores on the “Mystery App” Sparkle are quite different from the official results. University of Washington is again at the top of the list with an astounding 183.33% score, which means they really did a great job of optimizing this app. NC State University came in second with a score of 147.40%. Nanyang Tech nabbed third place with 143.97%, followed by Wake Forest at 136.49% and University of Illinois Urbana Champaign at 134.52%
So who were the most efficient teams at SC19? Which teams did the best job of tuning their hardware and optimizing the software codes for maximum performance? This chart tells the story.
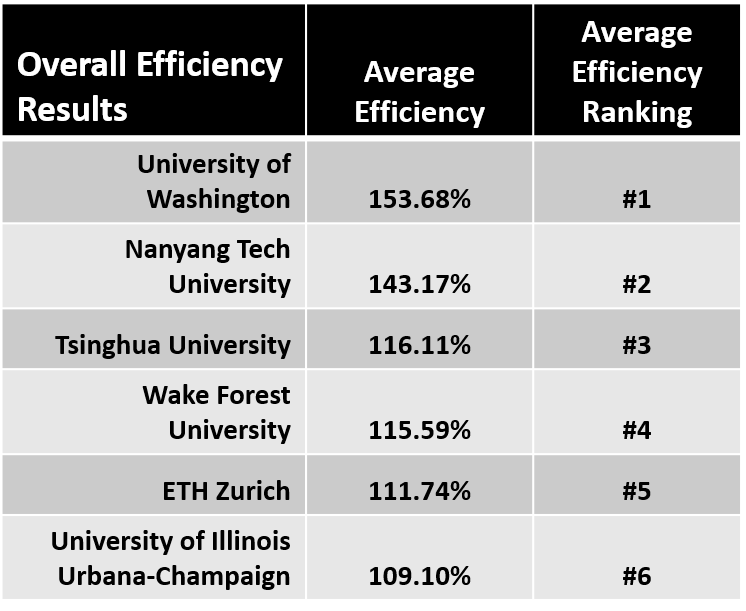 University of Washington had the highest overall average efficiency at 153.68%. This shouldn’t be much of a surprise given how their name kept popping up at or near the top of the charts again and again. Nanyang Technological University was second with 143.17%. Tsinghua University, the overall official winner of SC19 pulled into third place on the efficiency scores by posting a 116.11% average efficiency. A surprise entry, Wake Forest, was deceptively efficient at 115.59%. They pulled this off while not appearing in any of the top slots in the official scoring, which is quite a feat. Likewise ETH Zurich and University of Illinois UC finished fifth and sixth in efficiency but didn’t break into the top three on any of the official tallies.
This finishes off our SC19 Student Cluster Competition coverage, stick a fork in it, it’s done. But we have way more student competition news to report, including the results from the South African student competitions (they do more than just cluster competitions now), and the preparations for the Asian Student Cluster Competition coming up in April. For more details on cluster competition breaking news and history, check out www.studentclustercomp.com. And, as usual, stay tuned…..
Posted In: SC 2019 Denver, Latest News