I’ve been in the Student Cluster Competition game for a long time. I started following and writing about these competitions back in 2010 and have been working to spread the word ever since then. These are compelling and exciting competitions, no doubt about it.
But every time I see the scores from an event, I notice what seem like anomalies. I see teams that are achieving better scores than it seems like their hardware should support. For example, a team getting a better LINPACK or HPCG score than teams with many more GPUs.
To me, this is an example of a team that did an outstanding job of system and application optimization. The problem is that these teams often don’t post a score high enough to finish in the top three or four and get recognized for their effort. So the question is how to quantify these situations and recognize the teams for their accomplishments? That question has been bothering me for eight years. But I think I have a solution.
It’s All Relative
I burned up a lot of spreadsheets trying to figure out how to best highlight the teams that were punching above their weight when you compare their hardware to their application and benchmark scores. The problem is that I wasn’t looking at the problem correctly. I was trying to come up with a single objective measure of optimization/tuning performance, but as it turns out, the answer is in looking at the relative hardware configurations and benchmark/apps scores. That was the “ah ha!” moment.
From there, it was a feverish several hours of spreadsheeting and then many days of checking my algorithm and logic with people who know what they’re talking about. After all of that, I finally have a model that, I believe, does the best job of using the data I have to show which teams did the best job of getting the most out of their hardware.
Relative Cluster Power vs. App Performance
First, I needed to figure out the relative performance potential of each team’s cluster. I came up with a relatively simple method of normalizing six machine configuration metrics: Total CPU Cores, CPU Frequency, Total Memory, Interconnect Speed, GPU Cores, and GPU memory.
I didn’t try to add any weights to these factors because their relative value will be different for every workload and benchmark. So I simply normalized each individual component, then added up the scores and normalized every machine to the highest score. This is what I’m calling the “Machine Score.”
On the application and benchmark side , I normalized the scores to the highest score in each category and then ranked them. This is what I’m calling the “Application Score.”
The Efficiency Score
The combination of the Machine Score and the Application Score yields the Efficiency Score for each team on each application. If the Efficiency Score is more than 1.0, then that team has over-performed their hardware. As we’ll see in the tables below, there are several teams that significantly out-performed their clusters, even though they might not have had a high enough score to land in the top three or four slots overall. Let’s take a look….
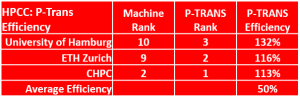 On the P-TRANS section of the HPCC benchmark, University of Hamburg had what we figured was the 10th best cluster in the competition but they managed to finish third overall on P-TRANS, giving them an efficiency score of 132%. In other words, they got 32% more performance out of their machine than other teams.
Likewise, ETH Zurich had the ninth best cluster in the competition, but grabbed second place on P-TRANS, yielding an efficiency score of 116%. CHPC also did a great job on optimizing and tuning for this benchmark, earning a 113% efficiency score.
These teams really excelled on this application when you consider that the average efficiency was only 50%.
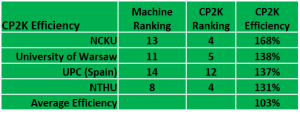 We really saw some surprises when we ran the numbers for CP2K. Taiwan’s National Cheng Kung University (NCKU), with their dual workstation cluster, had only the 13th best system in the competition. However, they finished fourth on CP2K, making them legends in their own time with an efficiency rating of 168%. Astounding.
University of Warsaw, aka the Warsaw Warriors, had the 11th best cluster, but pulled down fifth place, giving them an efficiency score of 138%. The Arm aficionados from UPC also did a great job of tuning and earned an efficiency score of 137%. The other team from Taiwan, NTHU, turned in yet another great CP2K efficiency score of 131%.
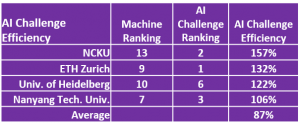 NCKU was on a tear, tackling the AI Challenge and turning in a second-place finish with an efficiency score of 157%. This was one application that didn’t require a lot of raw power, since students were scored by the accuracy of their result – not the speed of their finish.
ETH Zurich took home first place on the AI application and also scored very high on the efficiency scale with their 132% number. Heidelberg was also very efficient, using their 10th ranked cluster to nail down a sixth-place finish. Likewise, Nanyang took a 7th ranked machine and pushed it to a third-place finish on this app.
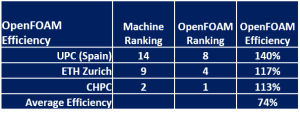 The Pride of Arm, Team UPC from Spain, took their 14th ranked system and drove it to an OpenFOAM eighth place finish. While this wasn’t enough to get them on the podium for this application, their efficiency score of 140% is remarkable, particularly given that OpenFOAM wasn’t exactly designed to run on Arm processors.
ETH Zurich and CHPC also did a great job of optimizing OpenFOAM on their clusters, earning efficiency scores of 117% and 113% respectively. This is quite a bit above the field average of 74% efficiency on this application, great job.
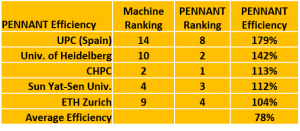 Team UPC turned in the highest efficiency score in the competition by finishing eighth on PENNANT. This gave them an amazing efficiency score of 179%…wow…that’s scary high.
University of Heidelberg tuned their 10th ranked cluster to a second-place finish on PENNANT
, giving them an efficiency score of 142%, which is also quite good. CHPC and Sun Yat-Sen pulled down efficiency scores of 113% and 112%, but it’s harder to get high efficiency scores when your Machine Score is also high – a team has to do a lot better on the application in order to get a modestly higher efficiency score.
Student Cluster Competitions are about more than just assembling the most hardware possible and brute forcing your way through them. Tuning and workload optimization play a big role in these competitions and I think we’ve finally found a way to quantify these factors. The efficiency score lets us recognize the achievements of these student teams who did a fantastic job on a difficult slate of applications.
If you have any thoughts about how to rate cluster competition efficiency or any ideas about how to make it a better measure, shoot me an email me at: dan.olds@orionx.net
To see how the competition ended, take a look at the awards ceremony video.
If you’d like to see the worldwide rankings of all Student Cluster Competition teams, check out the Student Cluster Competition Leadership List.
Posted In: Latest News, ISC 2019 Frankfurt
